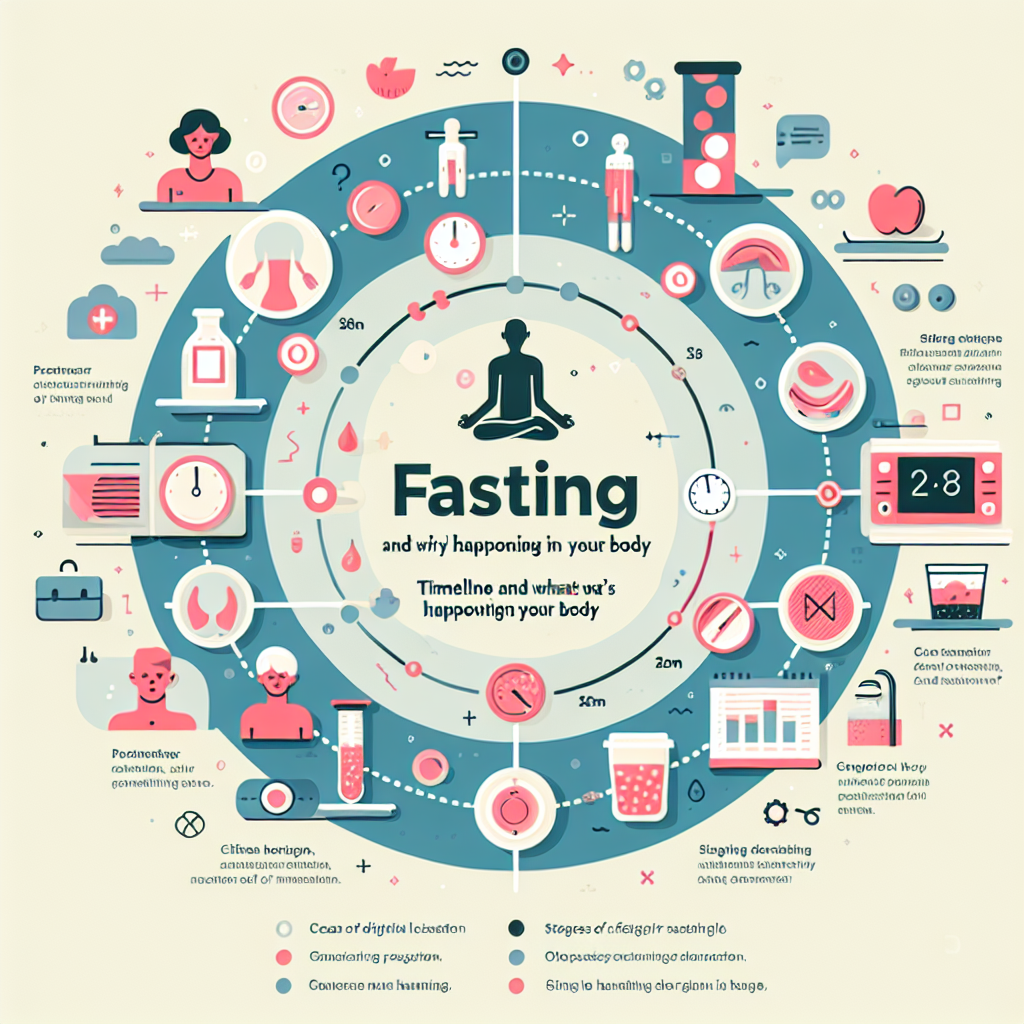
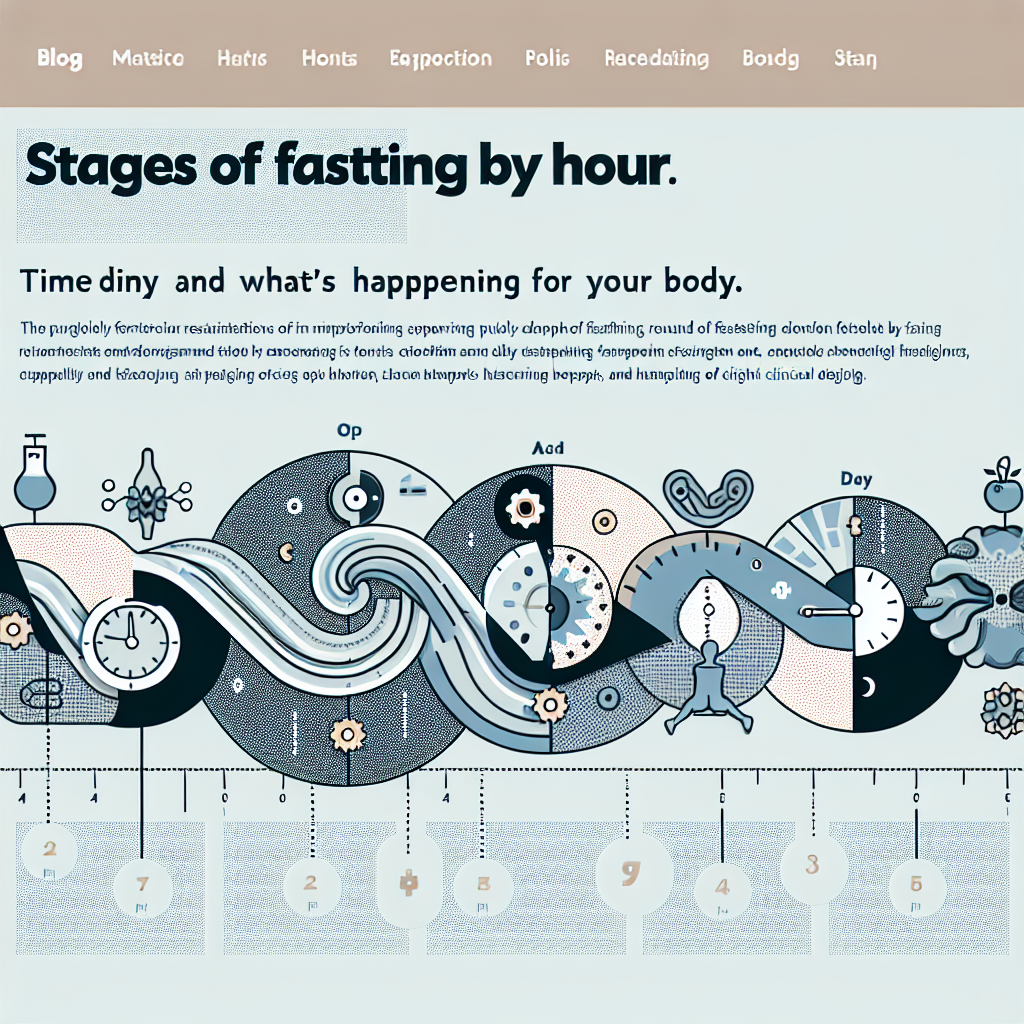
Understanding the stages of fasting by hour can help you plan a safe, effective fast and know what to expect physically and mentally. In the first day your body shifts from using dietary glucose to stored glycogen, then moves into increased fat burning and ketone production. Later extended fasts bring deeper cellular processes such as autophagy and immune modulation. Below is a practical hour-by-hour timeline that maps common fasting zones and metabolic shifts, plus notes on comparing longer fasts like 96-hour and 120-hour protocols.
Stages of fasting — by the hour timeline
0–6 hours: fed state and digestion
Shortly after eating you’re in the fed state: insulin is elevated, glucose is used for energy, and digestion prioritizes nutrient storage. This period is the first entry on any fasting chart by hour and represents minimal fat burning. In intermittent fasting patterns, this window is when you’d typically avoid breaking a fast to maintain benefits seen in an intermittent fasting ketosis chart.
6–12 hours: transition to fasting
As you reach 6–12 hours without food, insulin drops and glycogen stores begin to be used. You may start to feel hunger ebb and concentration improve. Many fasting charts show initial mental clarity and mild ketone presence in this zone. This early metabolic shift is common in stages of intermittent fasting and is the start of the hourly benefits of fasting chart many people follow.
12–24 hours: glycogen depletion and rising ketones
Between 12–24 hours the liver’s glycogen becomes depleted and lipolysis ramps up. Ketone production rises, supplying alternate fuel to brain and muscles. Blood sugar stabilizes and appetite often subsides. A fasting chart will mark this as a key threshold where metabolic flexibility becomes evident.
24–48 hours: deepening ketosis and early autophagy
Once you pass 24 hours, ketone levels increase further and cellular recycling processes begin to accelerate. Many autophagy fasting chart visuals place the early autophagy response here, though exact timing varies by individual. Appetite typically decreases and fat is now a primary energy source.
48–72 hours: robust autophagy and immune effects
Between two and three days of fasting, autophagy and related repair mechanisms are more pronounced, and you may notice improved mental clarity or reduced inflammation. This is the fasting zone where some clinical reports describe immune system recycling and benefits beyond weight loss. Hydration, electrolyte balance, and medical oversight become increasingly important in longer fasts.
72–96 hours: deeper cellular renewal (96 hour fast stages)
In the 72–96 hour range the 96 hour fast stages include stronger autophagic activity and continued ketosis. People pursuing a structured 96-hour fast often report metabolic resets and appetite changes. If you’re considering extended fasting, read guidance on a safe multi-day approach and consult a clinician; a full practical guide to a multi-day fast is available in our 96-hour fast resource: 96-hour fast: what to expect and how to do it safely.
96–120 hours: deeper effects and trade-offs (96 vs 120 hour fast)
Extending to 96–120 hours can amplify benefits such as more pronounced autophagy and potential regenerative responses often cited among 120 hour fasting benefits. However, the incremental benefits from 96 vs 120 hour fast must be weighed against increased risk of electrolyte imbalance, muscle loss, or adverse symptoms. A careful plan, supervision, and clear reasons for longer fasting are essential.
Practical charts and zones
Visual aids like an autophagy fasting chart or an hourly benefits of fasting chart can help you track changes across fasting zones. A simple fasting chart by hour will mark zones for fed, early fasting, ketosis onset, and deep fasting. For scientific context on cellular processes like autophagy, see this overview from a credible source: Autophagy — Wikipedia.
How to choose a fasting timeline
Decide based on goals (weight loss, metabolic health, cellular repair), experience level, and medical history. Short intermittent fasts are suitable for most; longer fasts require planning and sometimes professional supervision. Compare stages of intermittent fasting approaches to multi-day fasts and consider when the added complexity of a longer fast is justified.
- Takeaway: Early hours focus on glycogen use; ketones rise after ~12 hours.
- Takeaway: Autophagy and cellular repair increase notably after 24–48+ hours.
- Takeaway: 96 hour fast stages and 120 hour fasting benefits may offer deeper effects but also higher risk.
- Takeaway: Use fasting charts and zones to plan safely and consult a clinician for multi-day fasts.
FAQ — Can I do a long fast safely?
Many people can safely complete short fasts (12–24 hours) without supervision. Multi-day fasts (96 vs 120 hour fast) should be planned with attention to hydration, electrolytes, and medical advice, especially if you have underlying health conditions.
FAQ — When does autophagy start?
Autophagy begins at varying times depending on factors like prior diet, activity, and metabolism; markers often rise after 24–48 hours and increase with longer fasting, as shown in autophagy fasting chart summaries.
FAQ — What’s the best fasting chart to follow?
Choose a fasting chart that matches your goals: an intermittent fasting ketosis chart for daily windows, or an extended fasting chart for multi-day plans. Always prioritize safety, electrolyte balance, and professional guidance when extending beyond 48–72 hours.


